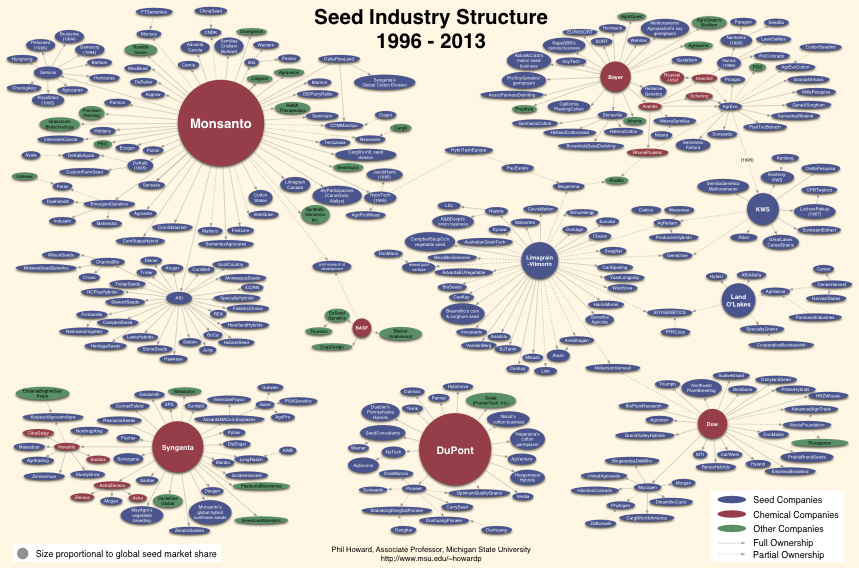
Consolidation has increased in the international seed industry in recent decades. This chart depicts changes in ownership involving major seed companies and their subsidiaries, primarily occurring from 1996 to 2013.1 The largest firms are represented as circles, with size proportional to global commercial seed market share.2

For an article providing more detail on these graphics see: Howard, Philip H. 2009. Visualizing Consolidation in the Global Seed Industry: 1996–2008. Sustainability, 1(4), 1266-1287. [PDF]
PDF version of Seed Industry Structure, 1996 – 2013 or PDF version for black and white printing
Network Animation of Changes in the Seed Industry, 1996-2008


Produced with SoNIA v1.2.0

The “Big 6” have entered into a number of agreements to share patented, genetically engineered seed traits with each other, such as herbicide tolerance and expression of insecticidal toxins.
PDF Version of Seed Industry Structure: Cross-Licensing Agreements for Genetically Engineered Traits
Notes
1. Data revised and updated from Pioneer Hi-Bred. 2000. “Seed Industry Structure.” Johnston, IA: Pioneer Hi-Bred International, Inc., Competitive Intelligence Group, Marketing Department (February).
2. 2011 Market share estimates from ETC Group. 2013. Putting the Cartel Before the Horse…and Farm, Seeds, Soil, Peasants, etc. (September).
Student research assistance provided by Corie Peterson and Daniel Herriges

Very useful image of the concentration of power in the seed market, is there an updated version after the Monsanto and Bayer merge?
LikeLike
If we can’t find a seed company on there (thank you for making the pdf searchable!) does that mean it is most likely independently owned? (Gurney’s from Greendale, IN)
LikeLike
Yes, it is likely it is not connected to one of these larger firms, but the most recent version I have (on this page https://philhoward.net/2018/12/31/global-seed-industry-changes-since-2013/) only captures changes through the end of 2018. Seedquest is a good resource for finding announcements of acquisitions since then.
LikeLike