
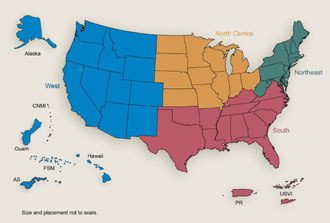
Sustainable Agriculture Research and Education Regions
The following graphics refer to the SARE Regions above, although California has been separated from the Western Region due to its size. Each cell in these “treemaps” represents a single farm, and its size is proportional to the sales or acreage category to which it belongs. Caution should be used in interpreting these graphics because the top categories are truncated (i.e. a farm with $10 million in sales is shown as the same size as a farm with $1 million in sales), and commodities vary substantially in market value and acreage requirements [1].

California has the largest number of farms with $1,000,000 or more in annual sales. The Southern Region
has the highest proportion of farms under $10,000 in annual sales.
PDF Version of Organic Farm Sales – 2002

The Northeast Region has the highest proportion of farms under 500 acres.
PDF Version of Organic Farm Acres – 2002
Literature Cited
1. Howard, Philip H. 2009. Visualizing food system concentration and consolidation. Southern Rural Sociology, 24(2), 87-110.

One thought on “Organic Farm Concentration”